Today’s post includes exercises for describing trends with pie charts and line graphs. The complete exercises with answers, audio and video are downloadable at the end of the post. For subscribers, there is also a fairly extensive past tense collection (13 exercises: including 5 video and 9 audio files).
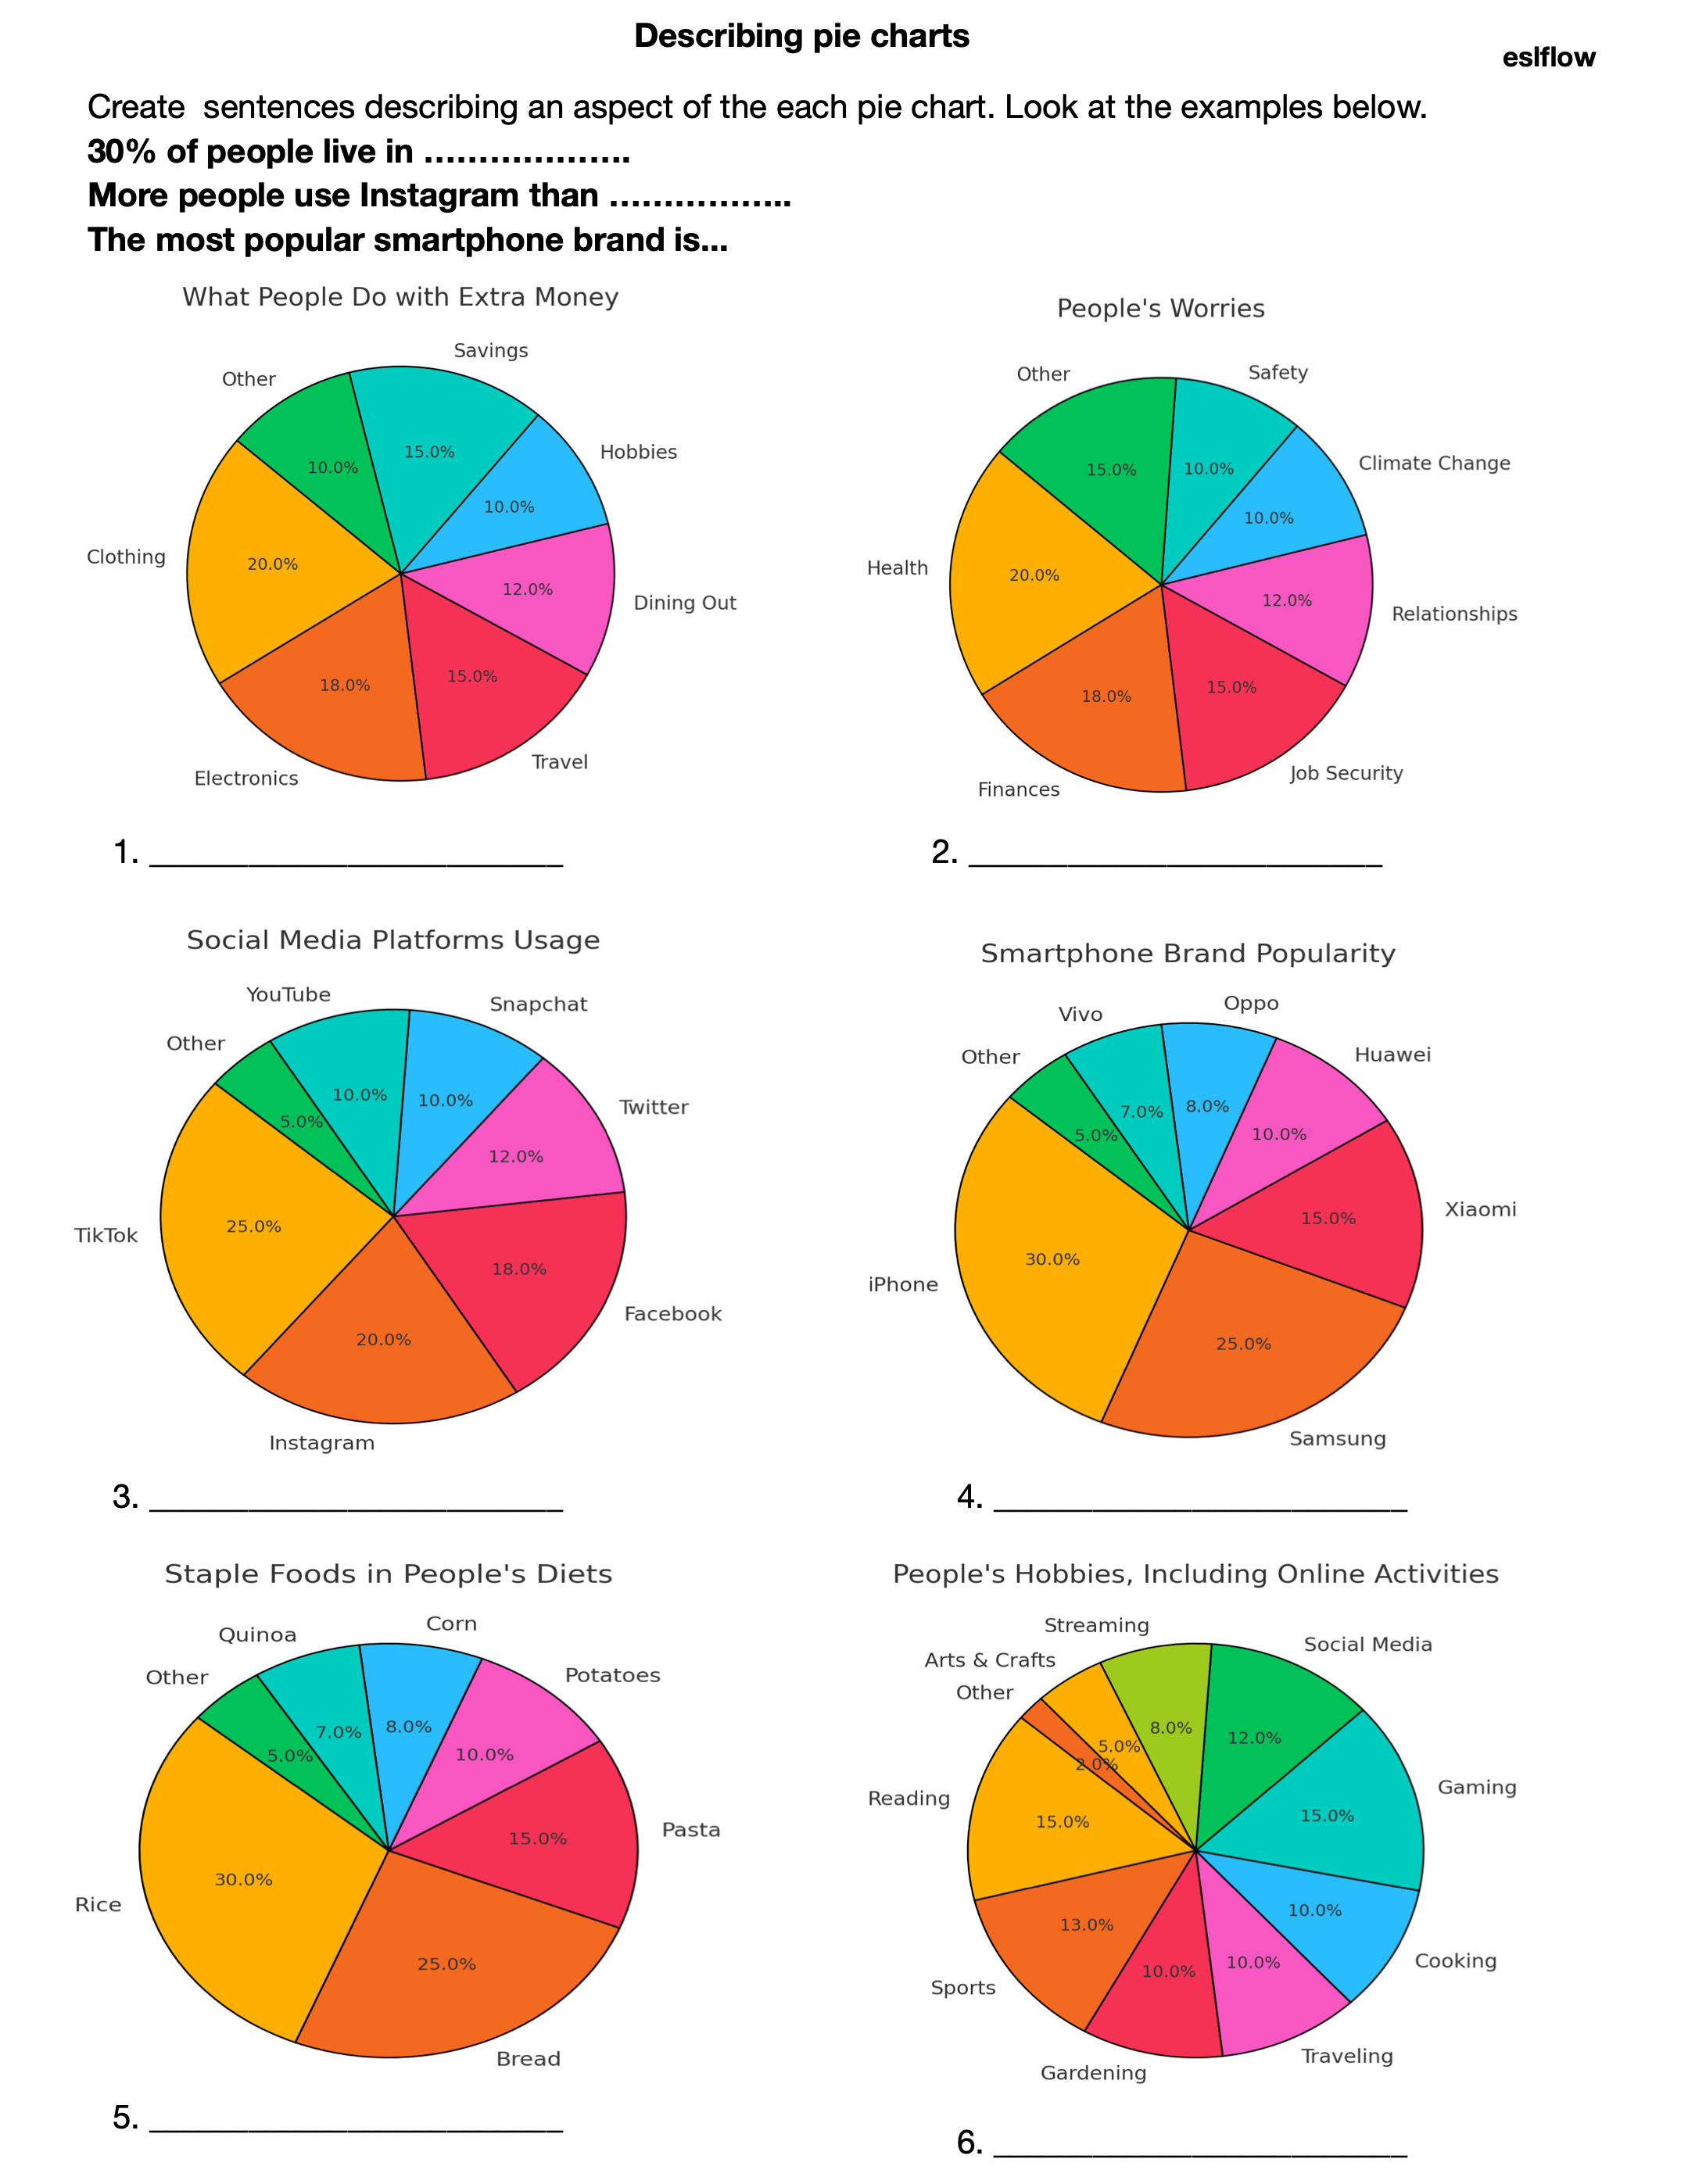
Pie Charts
OpenAI just launched Canvas several weeks ago. In many ways, it’s just catching up to some of the features included in Claude’s Artifacts. Now, both open new windows that give the user better control over the prompting and editing process. But OpenAI’s latest models can do some things that Claude can’t. So far, from my experiments, the most useful thing it can do is create accurate and editable (by prompting) graphs and charts.

With this feature, I was able to create a really nice exercise. Oh, I should mention that I used OpenAI for the pie charts, Claude for assistance with the audio script, and Microsoft for the audio. Pie charts are good for teaching comparatives, superlatives, numbers and percentages.
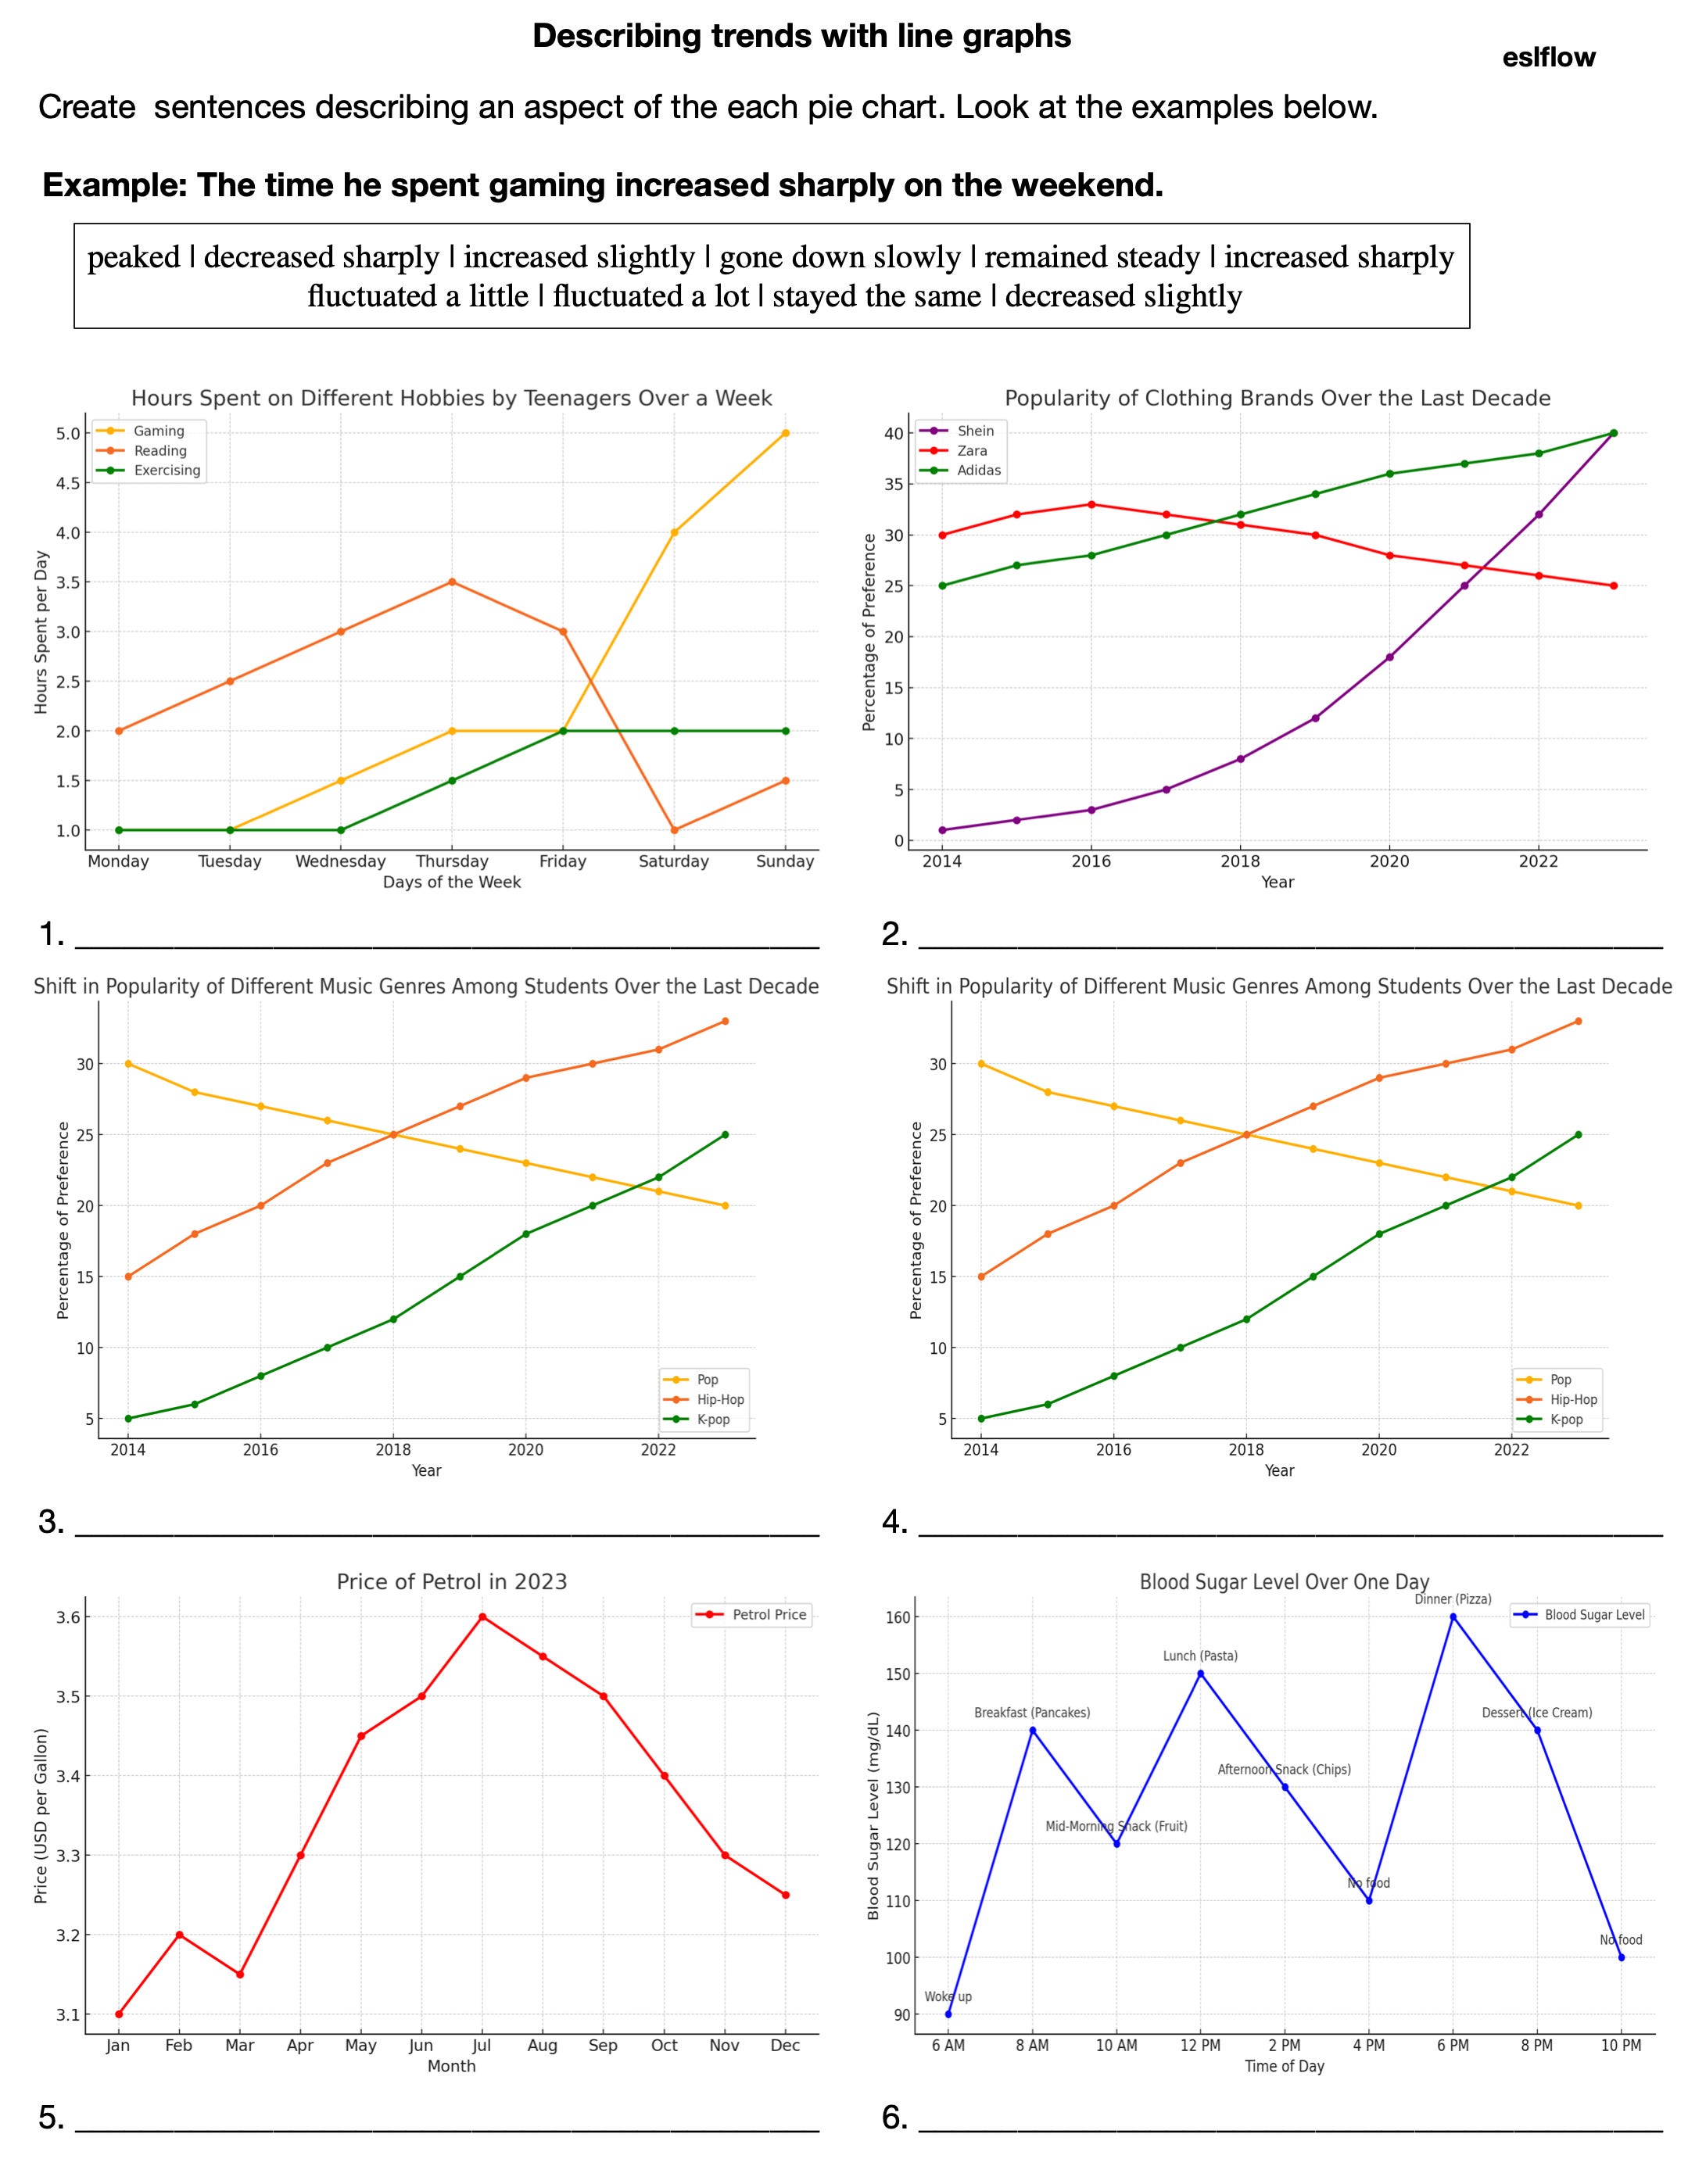
Describing trends with line graphs
Similarly, ChatGPT 4o with Canvas can create line graphs. This is a more advanced language exercise than the pie charts exercise as it requires specific language for describing trends (increase, decrease etc.).