Visualizing Data: The Communication Skill of Tomorrow
Elementary-Pre-Intermediate Directions Lesson | Data Visualization Lessons (General and Medical Science) | The Future of Medical Science
This Week’s Focus: Visualizing Data
Data visualization is an essential communication skill of our times. If you watch some of the best YouTubers, you’ll notice their effective use of a variety of graphs and charts. Generative AI makes these visual tools accessible to anyone.
So, as data is instantly available in the age of AI, the real skill is being aware of the different types of visualizations and having the critical thinking skills to decide which will convey your message most clearly. While creating these lessons, I discovered I could simultaneously explore the language of data visualization with exercises customized to my students’ career paths. I was surprised at how easy it was to create complex visualizations tailored to my students’ situations and how insightful they were about their futures.
What’s Inside:
This week offers four standalone lessons for different student needs. Elementary learners get comprehensive direction-giving practice with visual vocabulary and audio dialogues. For medical science students, there are two complete lessons: one exploring the future of medical research with predicted job changes and emerging fields, and another focused on data visualization in healthcare contexts. The general data visualization lesson works for any workplace-bound student, teaching 15 visualization types from pie charts to infographics with critical thinking exercises on skills gaps and professional communication. Each lesson is self-contained with visual vocabulary, language exercises, and complete answer keys.
Download the PDF to see the complete contents.
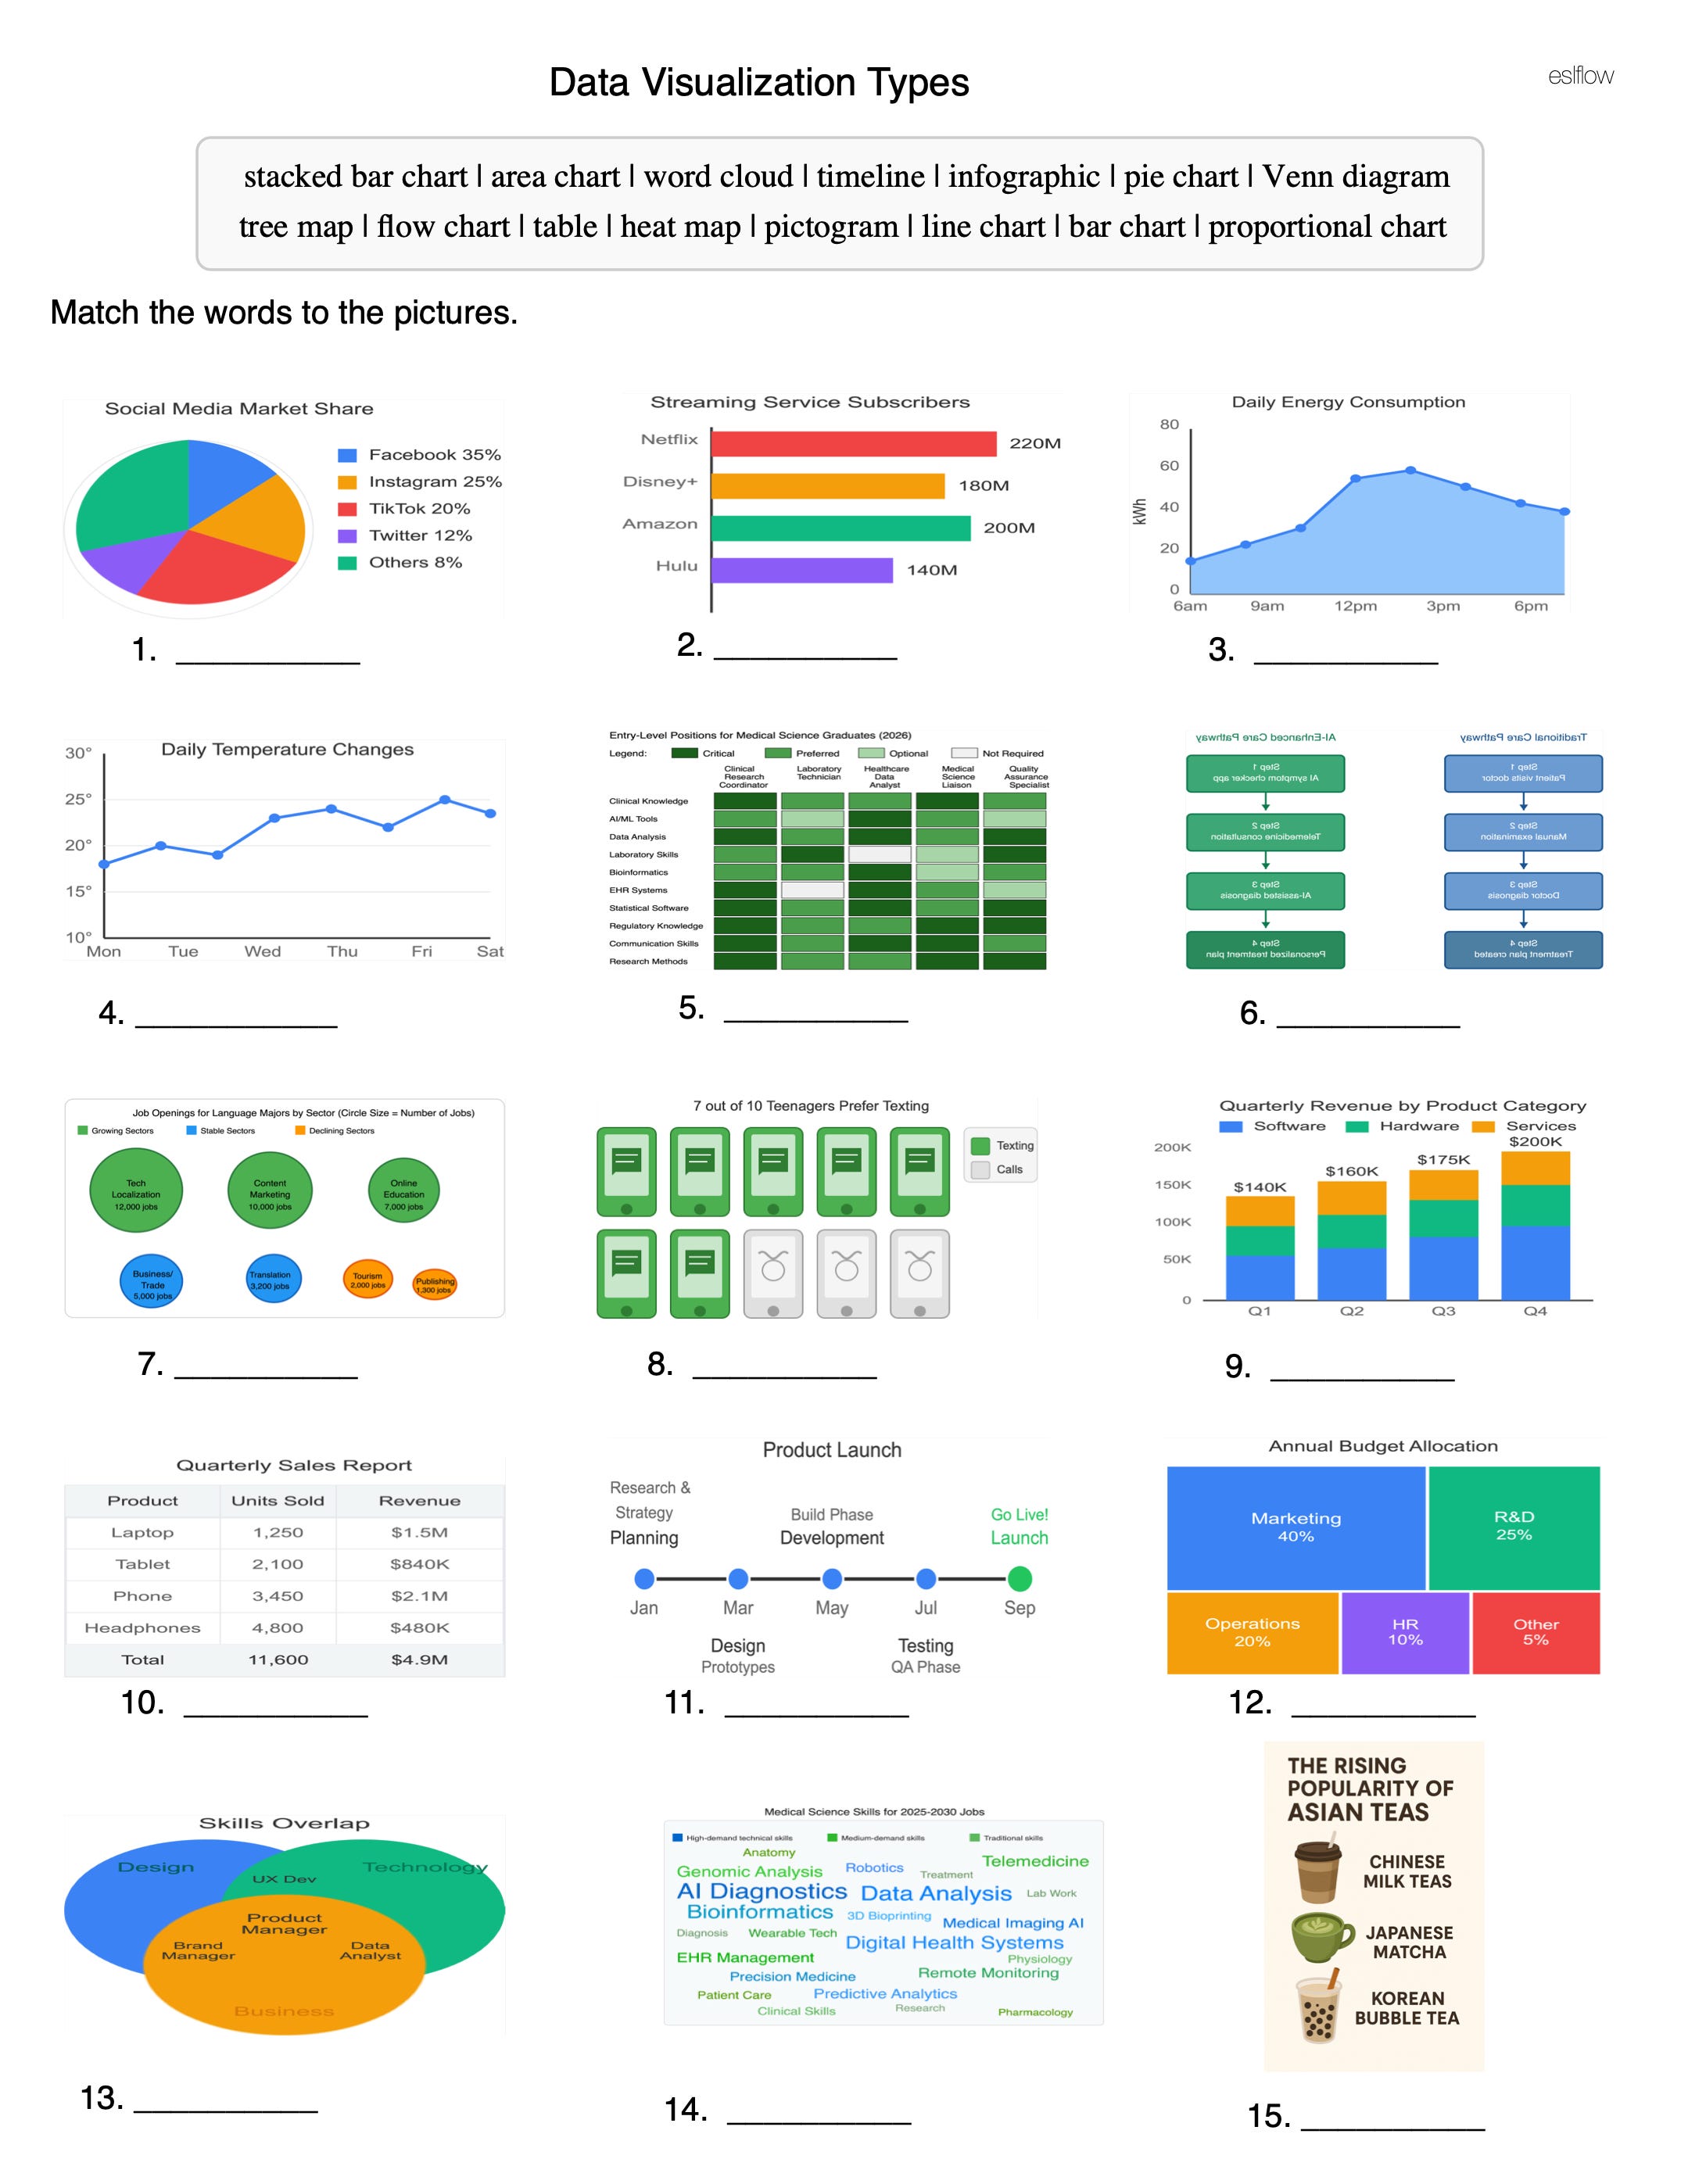
Data Visualization Types
Data visualizations feature prominently when we share information now—from Instagram stories to startup presentations. Knowing what to call each type means you can request, create, and critique the visuals that define modern communication
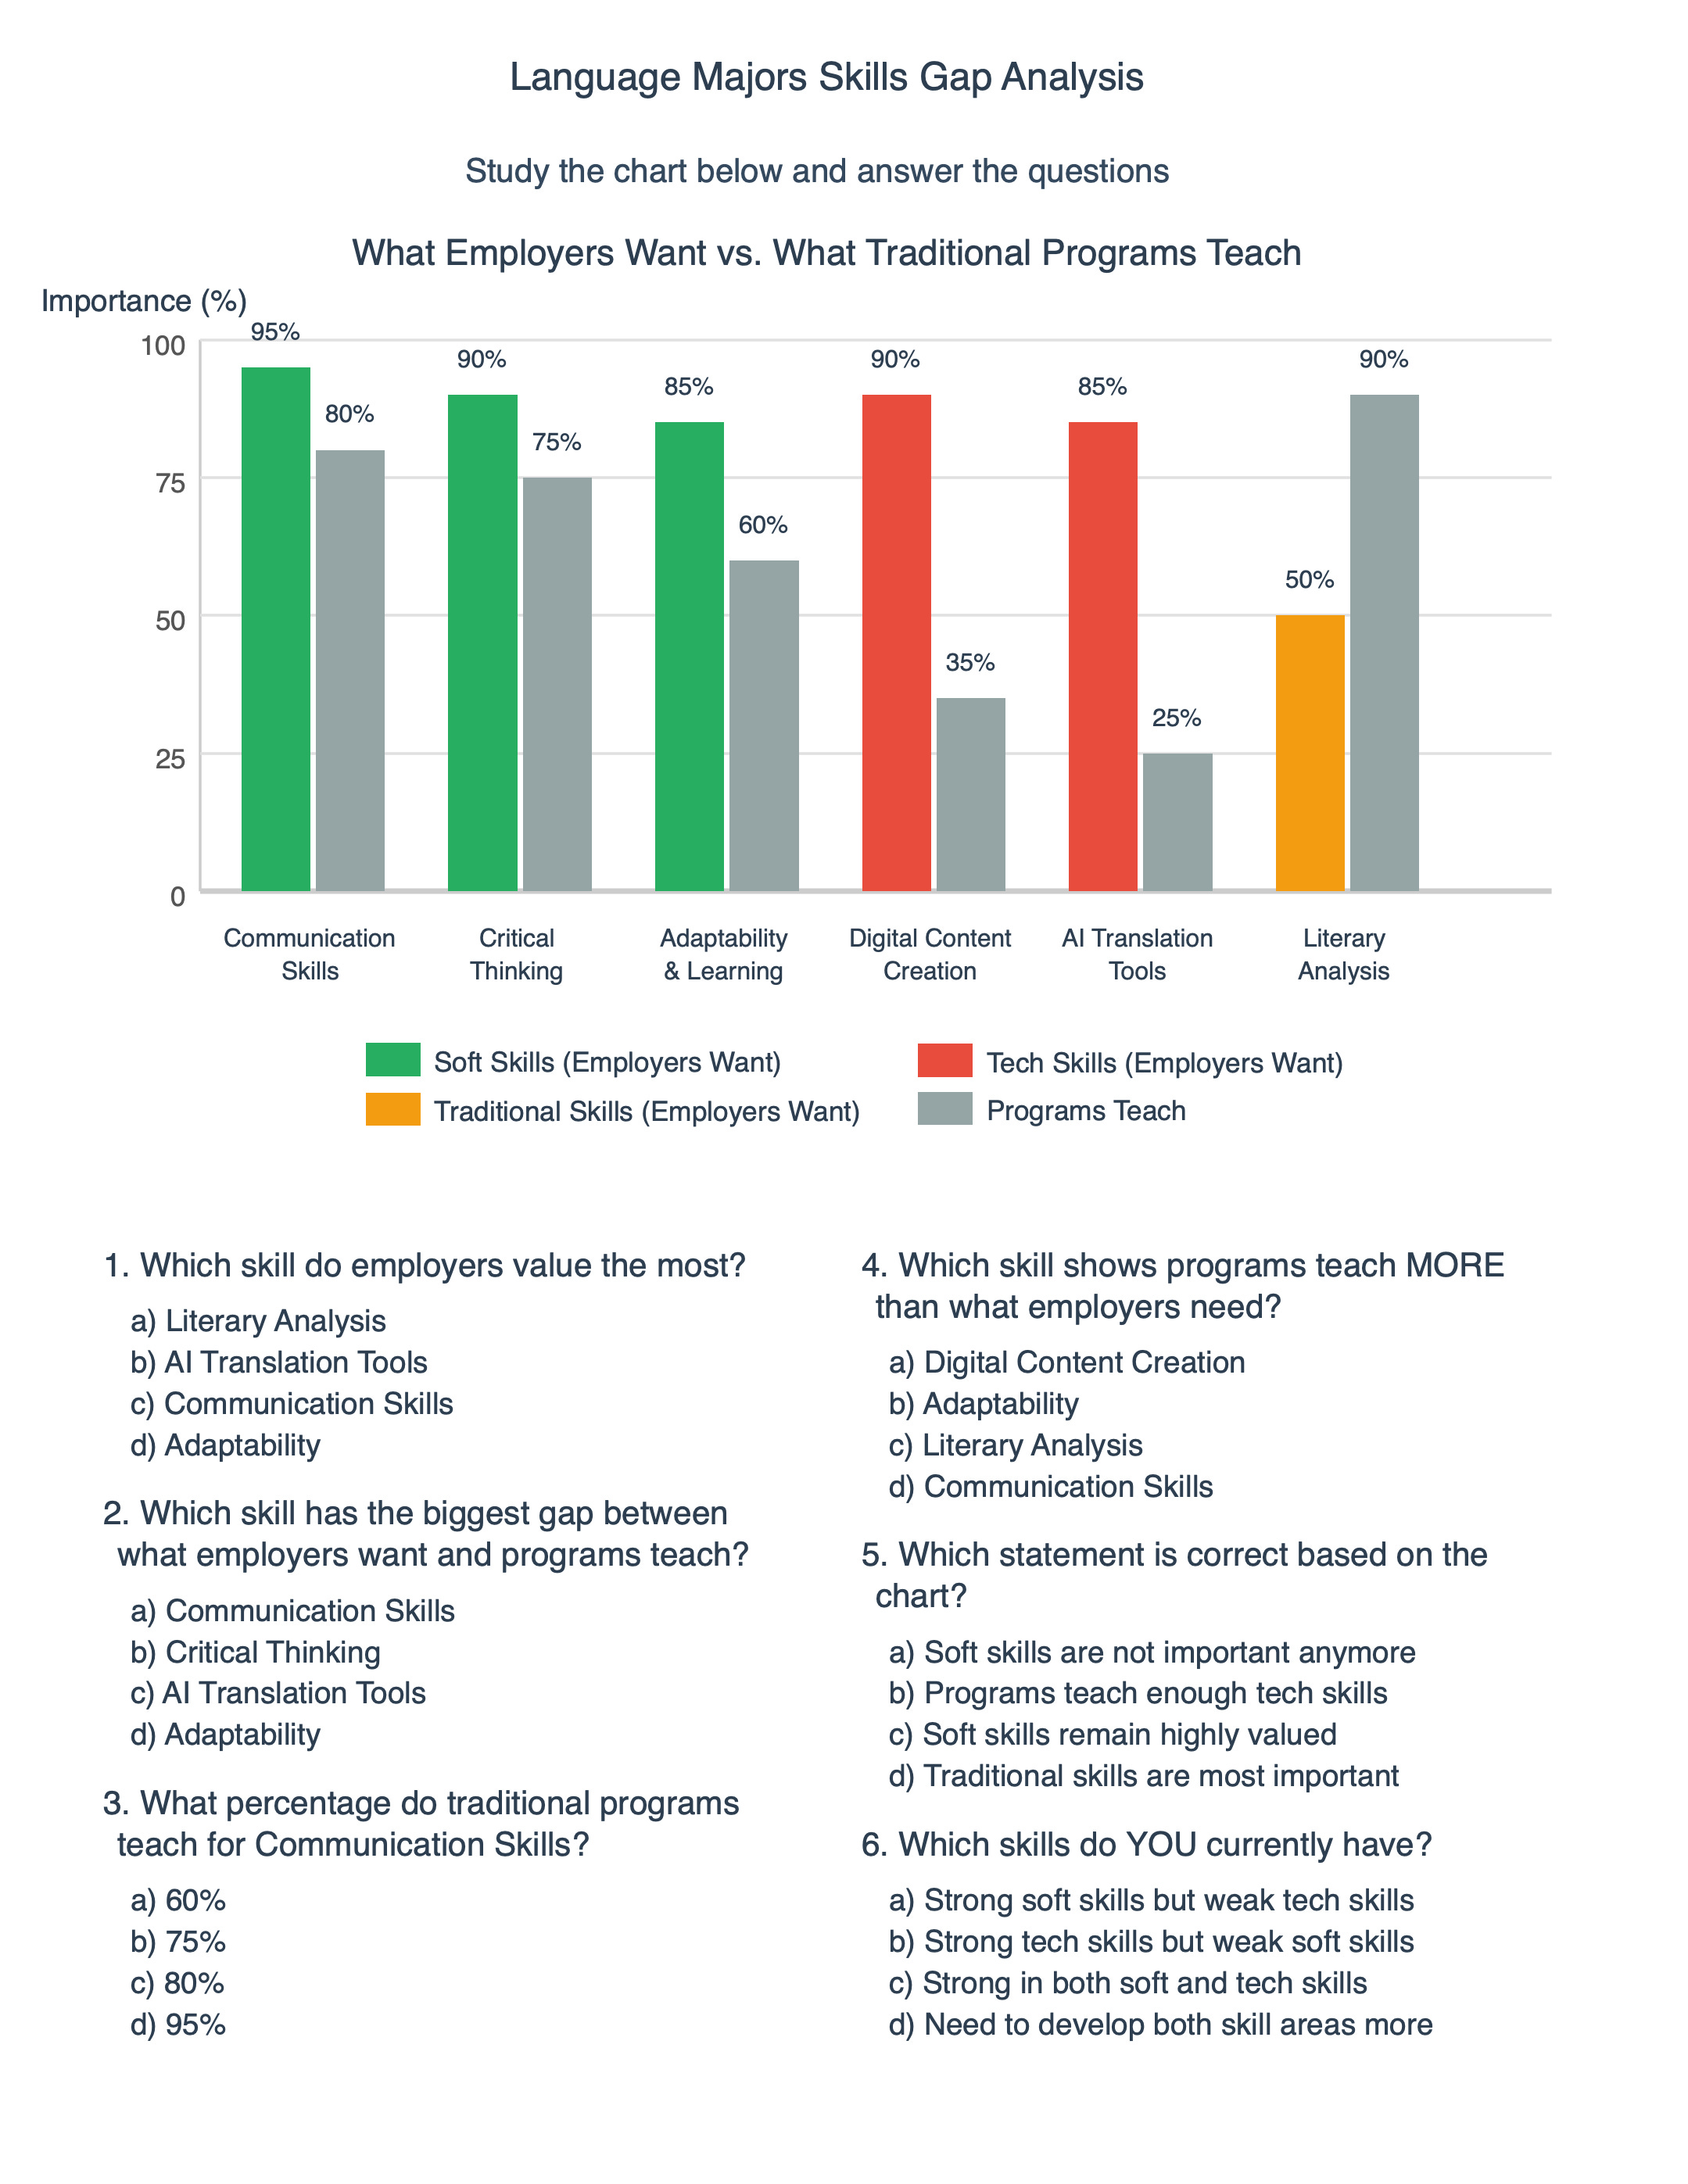
Visualization Exercise: Skills Gap Analysis (for language students)
Students are investing years in language degrees—this chart shows whether that investment matches what the job market demands. The gap between literary analysis skills and AI translation tools reveals exactly which capabilities students need to build outside the classroom to stay competitive.
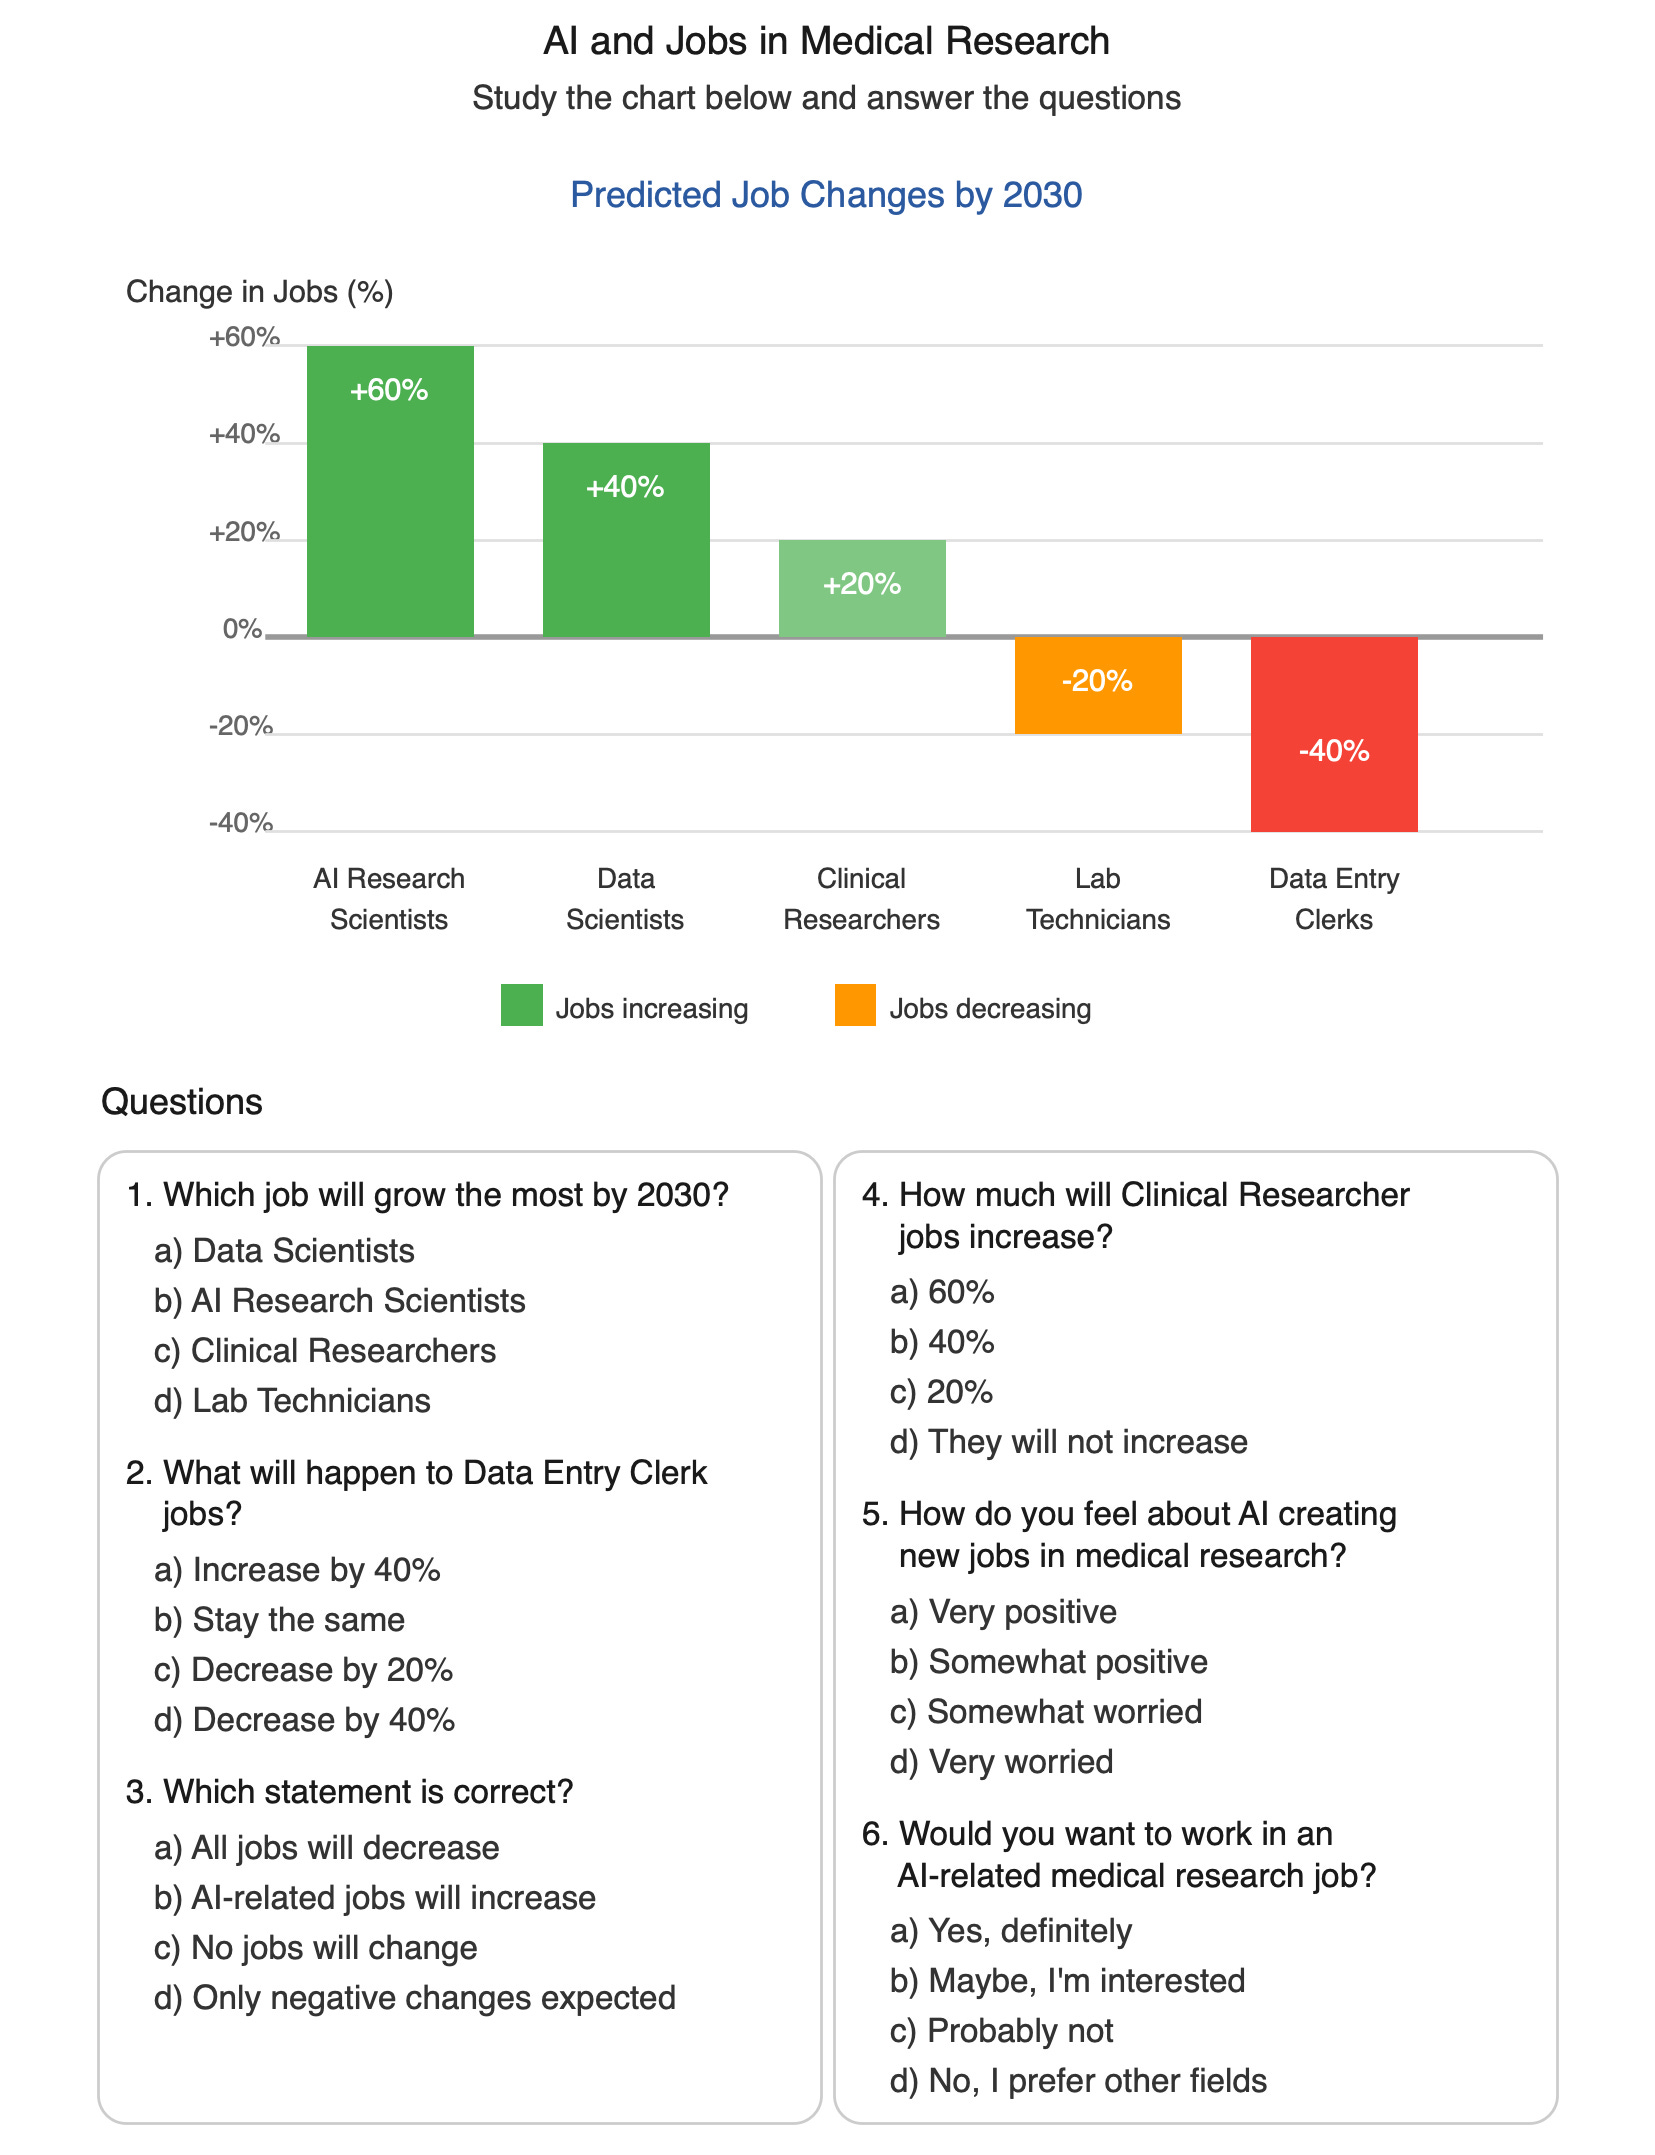
Visualization Exercise: AI and Jobs in Medical Research (for medical science students)
Medical science students are choosing specializations now that will define their careers in 2030. This chart provides concrete data on which roles AI will create versus eliminate, helping students make informed decisions about whether to pursue AI research skills or traditional lab work while the field transforms around them.